Update: Predicting the 2019 NHL Stanley Cup Playoff Results
Oof. Not even close.
First Round
Calgary Flamesvs Colorado Avalanche- San Jose Sharks vs
Vegas Golden Knights Nashville Predatorsvs Dallas StarsWinnipeg Jetsvs St. Louis BluesTampa Bay Lightningvs Columbus Blue Jackets- Boston Bruins vs
Toronto Maple Leafs Washington Capitalsvs Carolina Hurricanes- New York Islanders vs
Pittsburgh Penguins
Sharks made it to the Conference Finals. That’s pretty much as far as I got correct.
Random coinflips predicted the First Round better than I did at a 37.5% accuracy vs my 12.5%.
Congrats Blues on the cup win.
Predicting the 2019 NHL Stanley Cup Playoff Results
Here are my predictions for the 2019 Stanley Cup Playoffs. Winners in turquoise.
First round
- Calgary Flames vs Colorado Avalanche
- San Jose Sharks vs Vegas Golden Knights
- Nashville Predators vs Dallas Stars
- Winnipeg Jets vs St. Louis Blues
- Tampa Bay Lightning vs Columbus Blue Jackets
- Boston Bruins vs Toronto Maple Leafs
- Washington Capitals vs Carolina Hurricanes
- New York Islanders vs Pittsburgh Penguins
Second round
- Calgary Flames vs San Jose Sharks
- Nashville Predators vs Winnipeg Jets
- Tampa Bay Lightning vs Toronto Maple Leafs
- Washington Capitals vs Pittsburgh Penguins
Conference Finals
- San Jose Sharks vs Winnipeg Jets
- Tampa Bay Lightning vs Washington Capitals
Stanley Cup Final
- San Jose Sharks vs Tampa Bay Lightning
The above was constructed by me, a human, using hockey knowledge. The following is another prediction for the NHL Stanley Cup Playoffs using best of seven random coin flips to determine the winner for each pair. Let’s see if I can predict the results with better accuracy than random coin flips. Will report back after the playoffs.
First round
- Calgary Flames vs Colorado Avalanche
- San Jose Sharks vs Vegas Golden Knights
- Nashville Predators vs Dallas Stars
- Winnipeg Jets vs St. Louis Blues
- Tampa Bay Lightning vs Columbus Blue Jackets
- Boston Bruins vs Toronto Maple Leafs
- Washington Capitals vs Carolina Hurricanes
- New York Islanders vs Pittsburgh Penguins
Second round
- Colorado Avalanche vs San Jose Sharks
- Nashville Predators vs Winnipeg Jets
- Tampa Bay Lightning vs Boston Bruins
- Carolina Hurricanes vs Pittsburgh Penguins
Conference Finals
- Colorado Avalanche vs Nashville Predators
- Tampa Bay Lightning vs Pittsburgh Penguins
Stanley Cup Final
- Colorado Avalanche vs Pittsburgh Penguins
One year of cube solve timings (Jan. 2018 – Jan. 2019)
 A year ago, I bought a $6 Duncan-branded “Quick Cube” after my last cube started literally falling apart. Since then, I’ve kept the cube at my desk and recorded timings throughout each day. The following is a visualization of a year’s worth of timings:
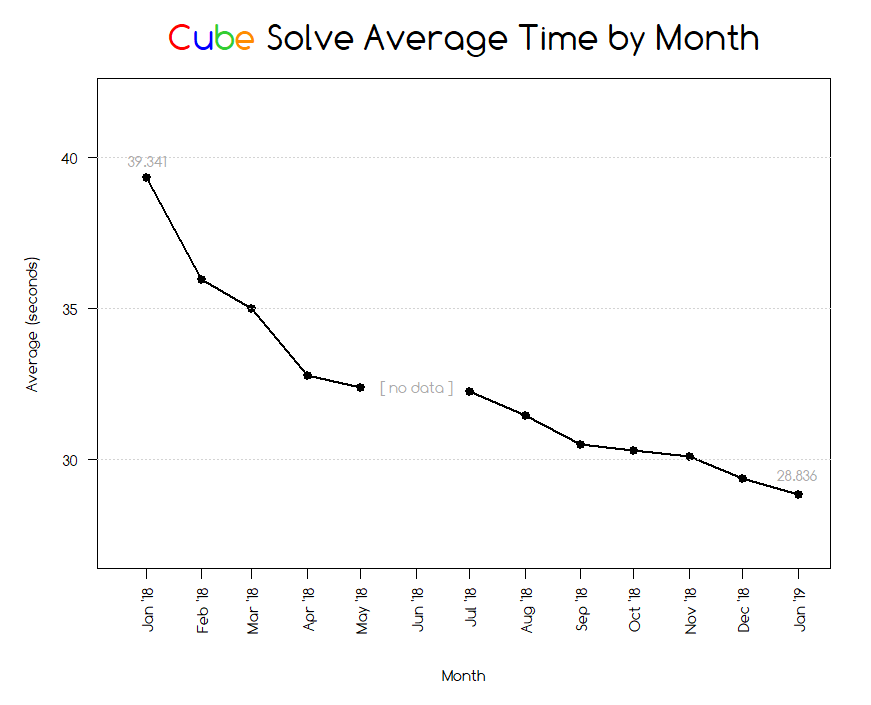 Sample count is about 12,500 which comes out to about 34 solves per day (wow…). Fastest solve for the year was 13.071 seconds due to some luck. I solve using a variation of a beginner’s method that was taught in the instructions that came with my first cube.
Beginner’s method steps (steps in red are combined in my method)
- Solve a cross on first layer
- Solve first layer corners
- Solve second layer
- Cross on last layer
- Last layer edges
- Last layer corners
- Orient the last layer corners
I used the same method all year. There exist plenty of methods that are way faster than mine but I’m not interested in dedicating the time to memorizing the algorithms involved. For anyone wondering, world record average of 5 solves is somewhere around 5.97 seconds (held by Feliks Zemdegs).
Sub-30s is fine enough for me. I consider that a goal reached and have no plans of pushing it further.
Data captured using the Cube Timer app on Android. Exported to csv and visualized using R.
A Heat Map
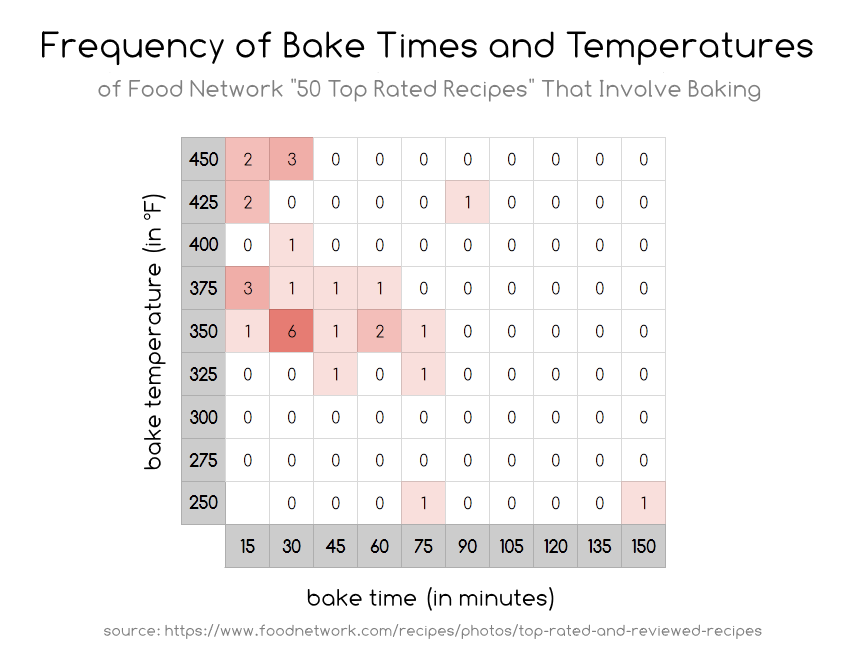
Only included the 31 of the 50 in the list that involved one baking step. Bake times rounded to the nearest 15 minutes. Weird outlier is a recipe for ribs–baked for 2.5 hours at 250°F.
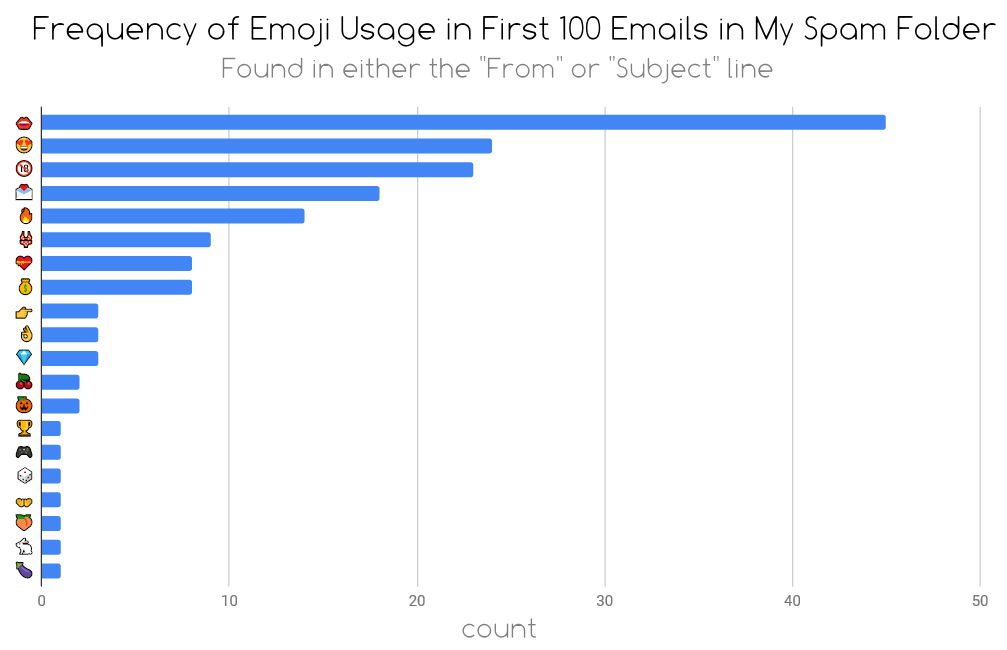
Emoji Spam
Modern Historical Context of Supreme Court Justice Confirmations
Judge Brett Kavanaugh was confirmed to the Supreme Court yesterday by a slim majority. The battle leading up to his confirmation seemed particularly partisan. In order to better understand what was unique about Kavanaugh’s confirmation process, I threw together this timeline to help visualize the historical context of all current justices’ confirmations. I’ve included Barack Obama’s nomination of Merrick Garland in the timeline to highlight what I view as hypocritical behavior of the majority party in confirming Kavanaugh at the height of campaigning during an election year.
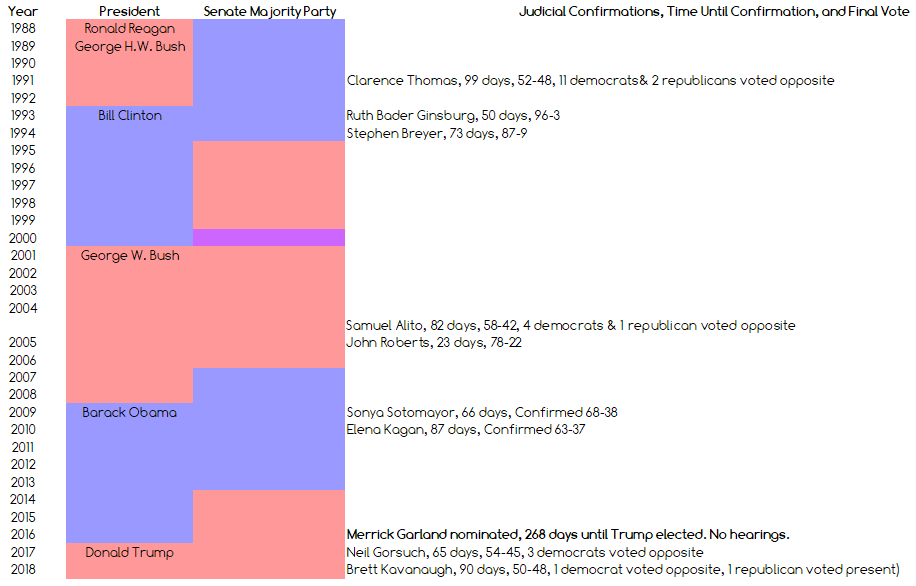
Looking through the timeline of the current justices, Stephen Breyer, Elena Kagan, Merrick Garland, and Brett Kavanaugh were nominated during election years. Which is most fitting for comparison to Kavanaugh’s confirmation process?
- Breyer’s nomination in 1994 resembled Kavanaugh’s nomination in that both occurred during an election year with the nominating President and Senate majority being of the same party. However, it doesn’t look like there was much of a fight, perhaps because Breyer was replacing a justice of similar political leanings.
- In Kagan’s nomination in 2010, Republicans delayed mildly delayed her confirmation. However, she was ultimately confirmed by a 63-37 vote. Looking through old news reports, I see no evidence that Republicans refused to confirm Kagan during an election year, perhaps because Kagan was replacing a justice of similar political leanings.
- Garland’s nomination in 2016 resembles the nomination of Kavanaugh in two ways: both were during election years and both involved the possibility of a judge replacing an outgoing justice that had “opposite” political leanings (Garland vs Scalia, Kavanaugh vs Kennedy).
Thus, Garland’s nomination was the recent nomination that most resembled Kavanaugh’s. Unfortunately, it looks like the majority party was inconsistent in how it applied standards in these two cases. The majority party had no problem exercising the tools in its power when it came to Supreme Court confirmations for its own benefit: delaying a confirmation and leaving a vacancy for 422 full days (longest in US history since 1846) and claiming it being due to falling on an election year, yet immediately doing the opposite two years later to fill a vacancy 30 days before midterm elections. Maybe it’s because one was a presidential election and the other was a midterm, but more likely they did what they did because they could. We can only speculate if Senate Democrats would have displayed the same hypocrisy had tables been turned, but there is no modern equivalent with parties flipped for comparison. One would have to dig further back to get a sense of how normal Senate Republican behavior for Supreme Court nominations has been.
Frequency of Scores in the NHL 2017-2018 Regular Season
“How many goals are usually scored in a hockey game?”
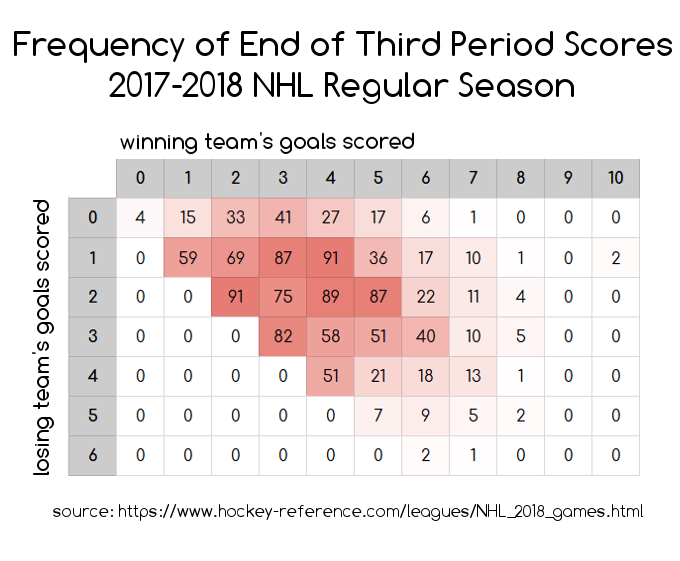
I had this question the other day and wanted to find out. A quick google search gave me this list of all game results from the 2017-2018 season. I wanted to visualize this data so decided to use R to generate a heat map of score frequencies.
Eventually, I ditched using R because I couldn’t for the life of me get the graphs to look pretty. Meanwhile, a copy and paste of data into Google Sheets and a couple minutes of clicking gave me the output I wanted. Friendly reminder to all to use the appropriate tool for the task.
Here’s what I found:
 This answers the original question–most hockey games will end around the neighborhood of a 2-1, 3-2, or 4-3 score. I posted this on Reddit and an interesting question was asked a few times. What would this graph look like if I adjusted scores in overtime and shootout wins? In the NHL, if a team ends in the 3rd period with a tied score, they go into a 3v3 5-minute sudden-death overtime period. If no goal is scored during that overtime, the teams go into a shootout. Ultimately, one team will win and will be award the extra point onto their score.
This could be inflating the frequency of “N to N-1” scores.
I found the easiest way to adjust for overtime and shootout wins was to simply take all games that ended with an OT or SO and subtract one point from the winning team–essentially turning the chart into the scores at the end of the third period of regulation. Here is that adjusted chart:
 Now this is interesting. Updated observations: Most hockey games fall around the 3ish to 7ish total goals scored and there is a higher frequency of games ending in ties and games ending in 2-goal leads than there is of games ending in 1-goal leads. Notice that cells in the diagonal for 1-goal leads are lower in frequency than their neighbors to the right and to the bottom. e.g. a 1-0 score happened 15 times, but a 2-0 score happened 33 times and a 1-1 score happened 59 times. This continues until the sample sizes drop.
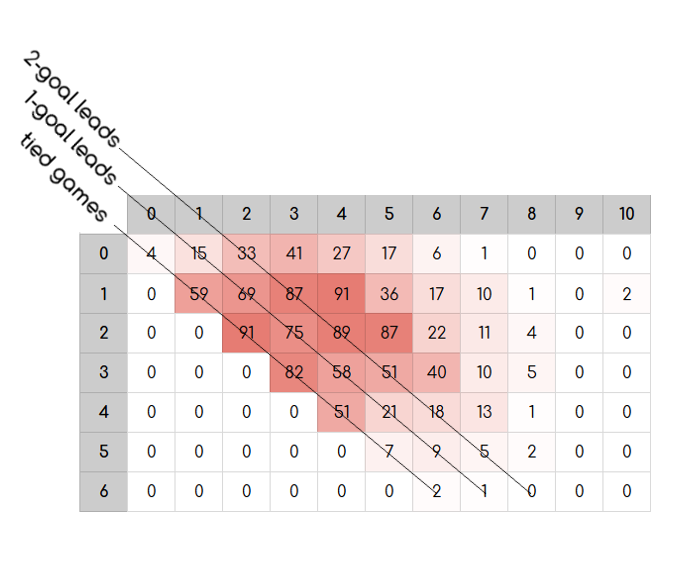
Why would this be? The simplest explanation would probably be the strategy of trailing teams pulling their goalie in the final moments of the third period.
In the NHL, the season is structured in the following way. All teams compete over the course of 82 games, each, and acquire points for each game win/loss/overtime or shootout. These accumulated points determine playoff seeding at the end of the season. The league awards 2 points for each win, 1 point for each overtime or shootout loss, and 0 points for each loss that doesn’t go into overtime. That means that a regulation loss is a loss, no matter what the score differential was by the end of the game.
In addition to the season structure, NHL rules allow for the goalie to be replaced with an extra skater at any point during play. Thus, it has become very common in the NHL for a team that is trailing by 1 in the final moments of the third period to replace their goalie with another skater in desperation. This makes sense. If our team is trailing by a goal, and it doesn’t matter in terms of playoff seeding points if we lose by another goal, it is worth the risk for us to do what we can to tie the game and send the game into overtime to maybe squeeze 1 point out of this game to affect our overall playoff standings.
Putting it all together, the NHL season structure + the rules for pulling a goalie could be contributing factors to inflation of frequencies of tied games (pulling the goalie worked) and games that ended in a 2 goal lead (pulling the goalie backfired and the other team scored on an empty net).
Vital Status of Wrestlers Appearing in WrestleMania I – XX
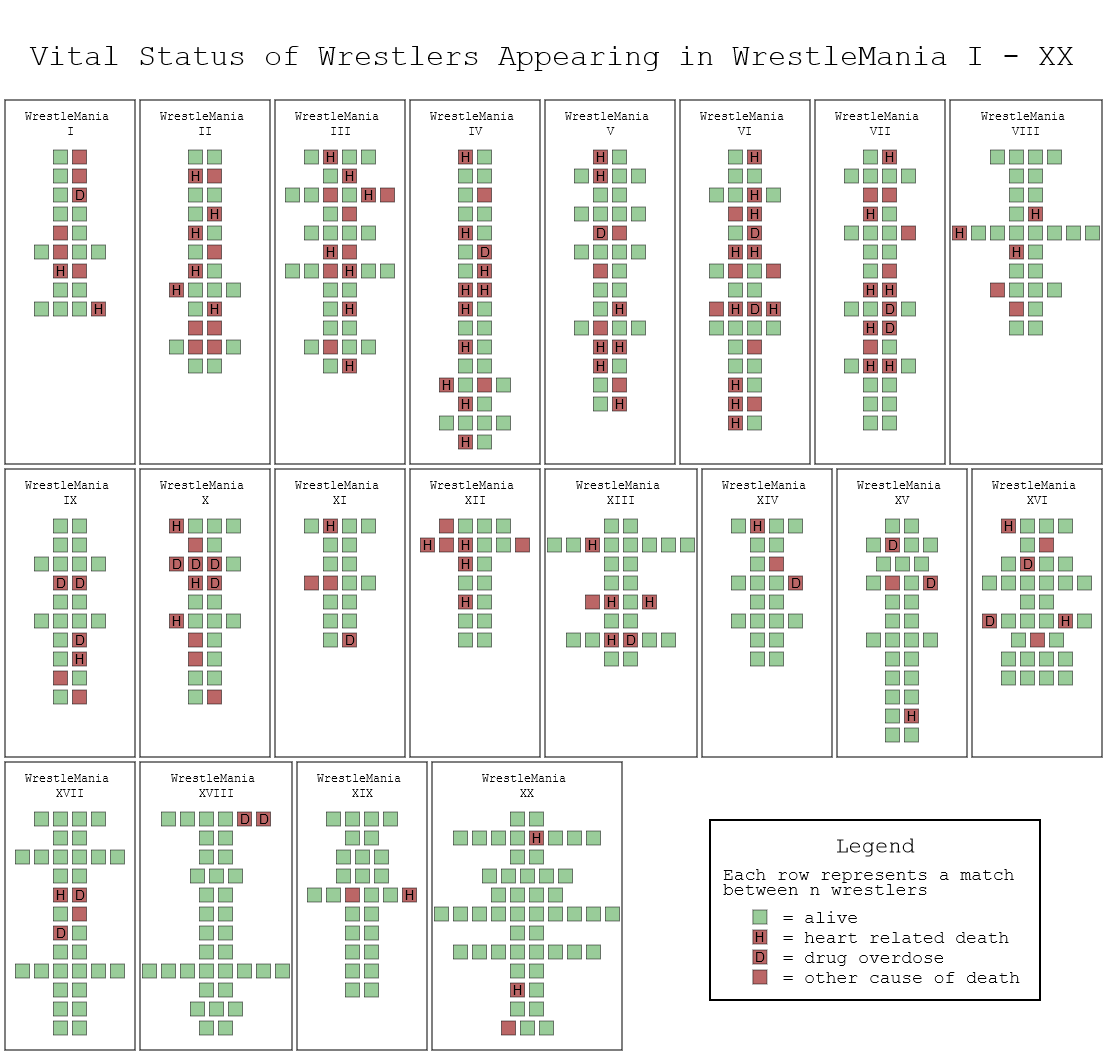
Jim “The Anvil” Neidhart, passed away yesterday. Neidhart was a wrestler from the WWF that I followed in the early 90s. He passed away at the age of 63.
I noticed that a lot of wrestlers that I watched as a kid have been passing away at relatively young ages. Furthermore, I noticed a trend that many of the deaths (not in Neidhart’s case) were drug or heart related. This made sense to me because a selection bias likely exists in this area where Wrestlemania participants are more likely than the average population to abuse steroids and other drugs. I wanted to visualize how many of these deaths were related to drugs or heart causes so here’s a thing I made:
The following is a visualization I crudely threw together using data from wikipedia entries as of 8/13/2018 and html5 canvas API. I’ve chosen WrestleManias 1 – 20 to visualize because these were roughly around the era I was most familiar with.
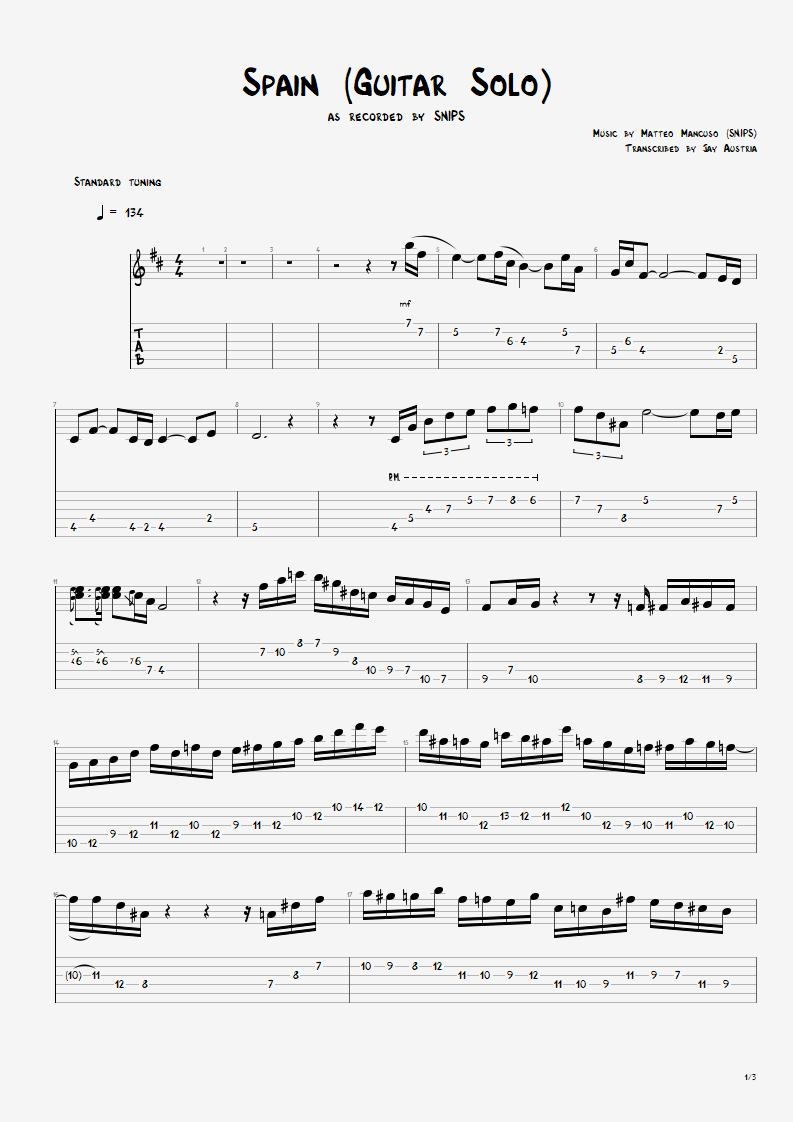
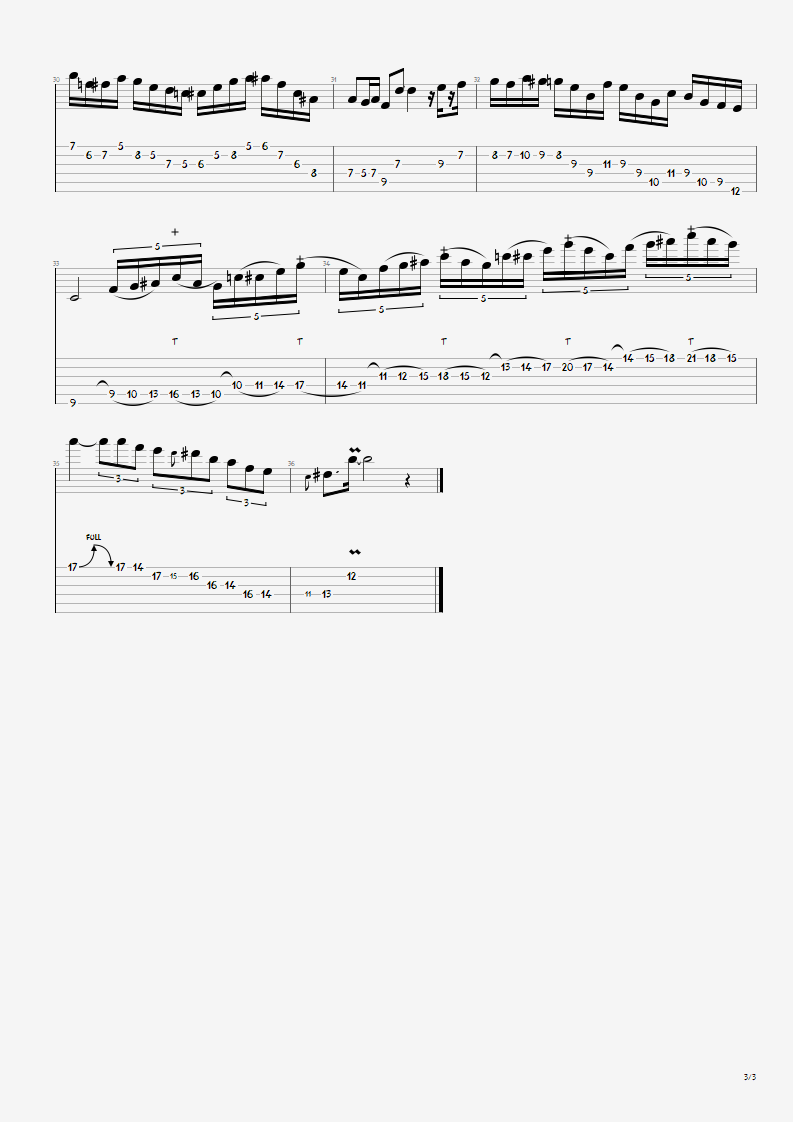
Spain (SNIPS) Solo Transcription
Transcription of the guitar solo in this excellent version of Spain I saw posted on reddit.com/r/jazz a few months ago. Solo begins around 1:48 and was last accessed July 16, 2018.
Full pdf here. Will update as errors get noticed.