Recently, I needed to submit an assignment for a college trigonometry course I was taking. My assignment involved modeling some scenario with a trigonometric function and my paper needed to include a bunch of math with all work shown.
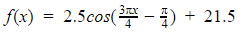
I started out with Google Docs, but I wasn’t at all happy about how unreadable all the math ended up looking when typed out:

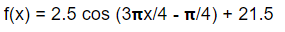
At a minimum, I could probably throw some π symbols in there, I thought.
That gave me this:
Still stupid looking. After some Googling, I came upon a few options for how to make neater looking math equations in a document.
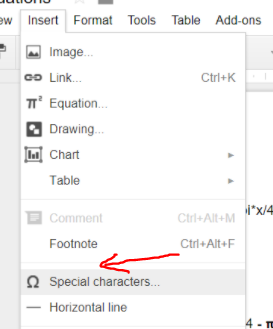
Option #1: Google Doc’s built-in Equations
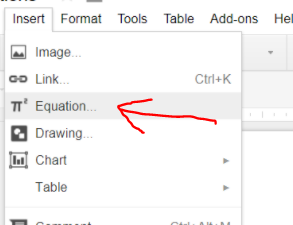
Going here adds this nifty little toolbar to the top of the editor:
It took a bit of fighting, but I was able to type out the symbols I wanted (in the Greek Letters dropdown) and stack the fractions (in the Math Operations dropdown).
The biggest downside here was that typing/editing equations is fairly cumbersome.
Option #2: Extending Google Doc Functionality with Auto-Latex Equations Plug-In
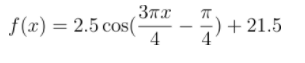
More Googling lead to me discovering that there were other options through Google Docs if I used a third-party plug-in. IMO, the best one of the bunch I tested was Auto-Latex Equations. This plug-in lets you type in LaTeX markup (more on this later) directly into your document like this:

…and then render all marked-up equations with the click of a button. It will scan the document for any markup and will replace those blocks of text with an inline image:
Learn more about the plug-in: https://sites.google.com/site/autolatexequations/
Option #3: Nerding out and going 100% LaTeX
Later, I decided to look more into this LaTeX thing. LaTeX is a document preparation / typesetting system that allows a user to author documents in plain-text with markup and then render the document out at a later stage. As a former professional programmer, this sounded Fun™.
I downloaded MiKTeX and Texmaker for Windows (kinda like downloading a compiler and an editor) and started learning more LaTeX markup. Setup took less than 5 minutes after following the installation instructions from both sites. Here’s a peek at the editor and my workflow:
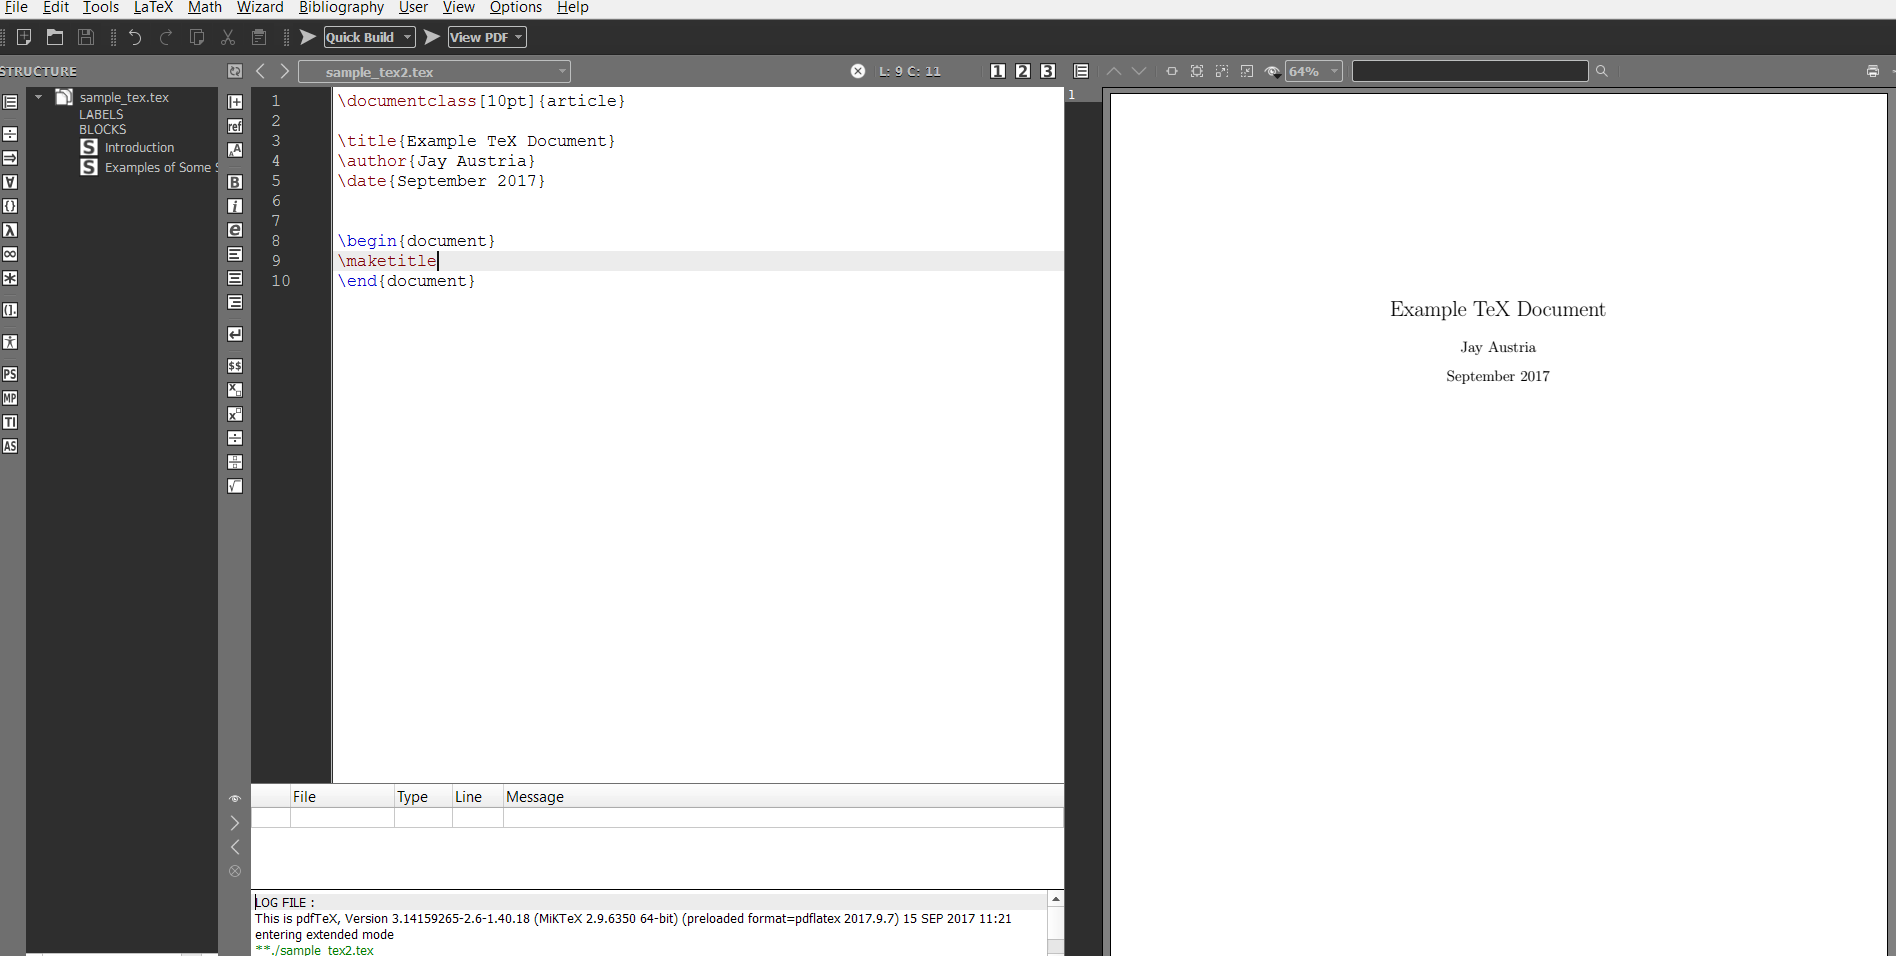
Workflow:
- Googling to learn new markup. Example searches: “latex insert image”, “latex align equations”, etc.
- Author my document in the left pane. Type stuff. Copy and paste stuff from the internet. Break things. Etc.
- Press F1 or hit the “Quick Build” button at the top to render out my document to a pdf. View the results on the right panel.
- Repeat until stuff looks how I want.
A sample LaTeX document:
\documentclass[10pt]{article}
\title{Example TeX Document}
\author{Jay Austria}
\date{September 2017}
% Cool, you can import packages for extra functionality
\usepackage{amsmath}
\usepackage{mathtools}
\usepackage{graphicx}
\usepackage[export]{adjustbox}
% Kill page numbering (on by defualt)
\pagenumbering{gobble}
\begin{document}
\maketitle
\section{Introduction}
This is a simple demo of a few of the things you can do with Texmaker + MiKTeX:
\section{Examples of Some Stuff}
The following is a quote:
\begin{quote}
“I like rice. Rice is great if you’re really hungry and want to eat 2,000 of something.” – Mitch Hedberg
\end{quote}
Oh look, math stuff:
$$f(x) = 2.5\cos(\frac{3 \pi x}{4} – \frac{\pi}{4})+21.5$$
Aligning equations:
\begin{align*}
3x + 1 &= 4x – 4\\
3x &= 4x – 5 && \text{Subtracted 1 from both sides}\\
-x &= -5 && \text{Subtracted $4x$ from both sides}\\
\Aboxed{x &= 5} && \text{Multiplied both sides by -1}
\end{align*}
Have this cat:
\includegraphics[scale=0.25, center]{cat.jpg}
Some observations about animals:
\begin{center}
\begin{tabular}{| l | l | l |}
\hline
Animal & Is it a cat?\\ \hline
dog & no \\ \hline
cat & yes \\ \hline
\hline
\end{tabular}
\end{center}
\end{document}
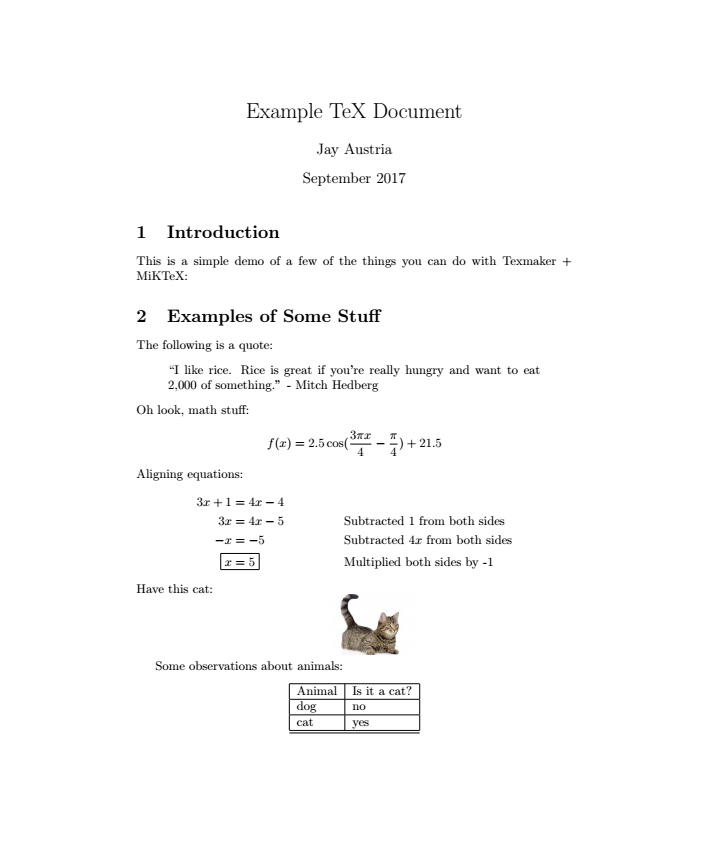
Which spits out this beautiful work of art as a PDF in the same directory as my .tex file.
Conclusion
Option 1 is probably fine for most people.
Options 2 and 3 start to get into the territory where your time investments start to get diminishing returns. If you’re quick at picking up new things, Option 2 gives a good balance of the portability of Google Docs and a faster way to write out nice looking functions.
Going with Option 3 is probably the most “over-engineered” approach to needing to write a paper with some math. Personally, I enjoyed the challenges involved when learning new markup and occasionally fighting things to get it formatted/positioned the way I want. I think it would be a great long-term investment for me to keep authoring things in this environment and internalizing some of the markup. LaTeX may come in handy if I’m ever wanting to author my own exams or other classroom material. For now, it mostly lets me pretend I’m programming again, but being honest–it hasn’t yet done anything major for me that I couldn’t have just done with Option 2 and Google Docs.
Bonus for anyone interested in learning: Here’s a YouTube tutorial that helped me with learning some basic LaTeX markup. Video credit to Michelle Krummel.