Month: June 2018
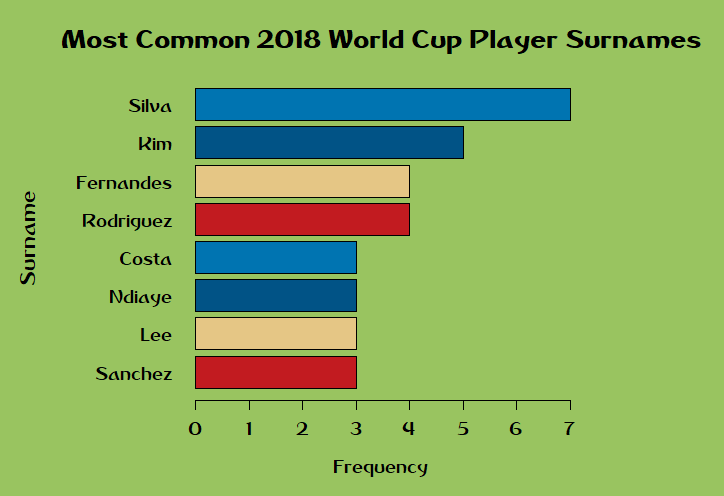
What Are the Most Common Surnames of World Cup Players?
Prompted by my observation that South Korea’s National Team has 5 different players with the surname “Kim”. I wondered if there was a more common surname in the World Cup. Used this little question as an excuse to continue tinkering with R and using data from data.world
How Important is Height in Hockey?
During my last recreational league hockey season, my captain had me play center. My favorite part (aside from face-offs) was the increased defensive responsibilities. I think it would be a fun idea to switch to defense for a season. However, I’m a bit concerned that at 5’7″ (67 inches) tall, I would be seen as too small to effectively play defense. I decided to check NHL stats and throw something together in R. Data includes all players currently in the NHL as of June 20, 2018.
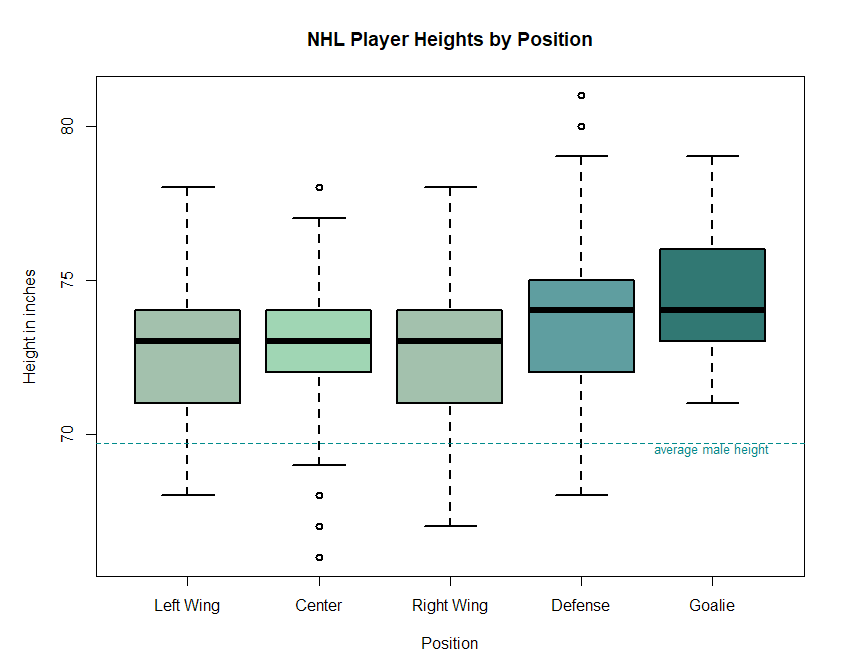
Based on my findings, it looks like there is a lot of variation across each position. Sure, the trend seems to be that players are taller the further back in the rink they are, but there is a lot of overlap in distributions of heights for each position.
- Median heights across all players is only about 3-5 inches taller than average males
- Roughly speaking, centers and wings are around the same height
- Heights for defensemen closely resemble the spread of heights for forwards, but shifted up about an inch
- Goalie is the one position where someone of my height playing the position would be a large outlier
After seeing the data, I don’t think that hockey has too much specialization based on height. Yeah, I’m not the tallest person, but especially for a rec league, I shouldn’t be discouraged from playing any position. I’ll sign myself up to play D next season.
Who are the Sharks’s Playmakers?
Similar to the last post, here is a visualization made with R of the players’ assists awarded over the last 5 seasons. Graph only includes players with at least 5 full NHL seasons of data and is not adjusted for games missed due to injuries.
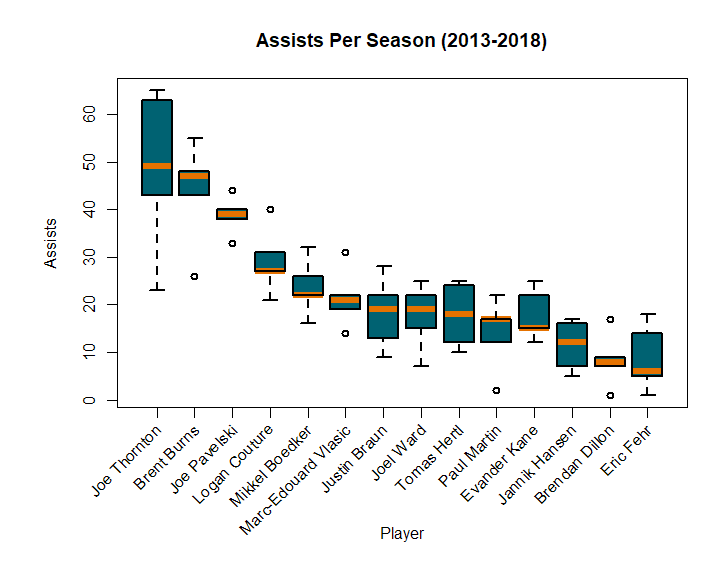
- Note: Mikkel Boedker was traded this morning to the Ottawa Senators.
- There weren’t any particularly notable exclusions from this list. Closest might be Kevin Labanc, who had a season high 29 assists last season, but only 2 full seasons of data to pull from.
- I mentioned Patrick Marleau in the last post. If he were included in this post, he’d fall around where Mikkel Boedker or Logan Couture are listed: He has a median assists count of 23 with a 5-season high of 38 in 2014-2015.
- John Tavares has a 5-season median of 42 assists with a high of 48 assists in 2014-205. If John Tavares were inserted into this graph, he’d fall right between Burns and Pavelski. Not bad!
Who are the Sharks’s Goal-Scorers?
There has been some off-season talk about the San Jose Sharks making a push to trade for John Tavares of the New York Islanders. Tavares has been a strong goal-scorer for the Islanders, having been in the top 3 on his team for goals scored every season since being drafted in 2009.
I wanted to better understand how goal scoring was distributed among the Sharks to make it easier to imagine Tavares being added to the line-up. I threw this visualization together using R to help out.
Data includes goals scored per San Jose Sharks player since the 2013-2014 NHL season. I only included current SJ Sharks players with at least 5 full NHL seasons of data. Data is not adjusted for games played, so games missed due to injuries are reflected in the graph. I think this is fair because a skilled goal scorer is useless if he isn’t also durable. Can’t put points on the board if you aren’t playing.
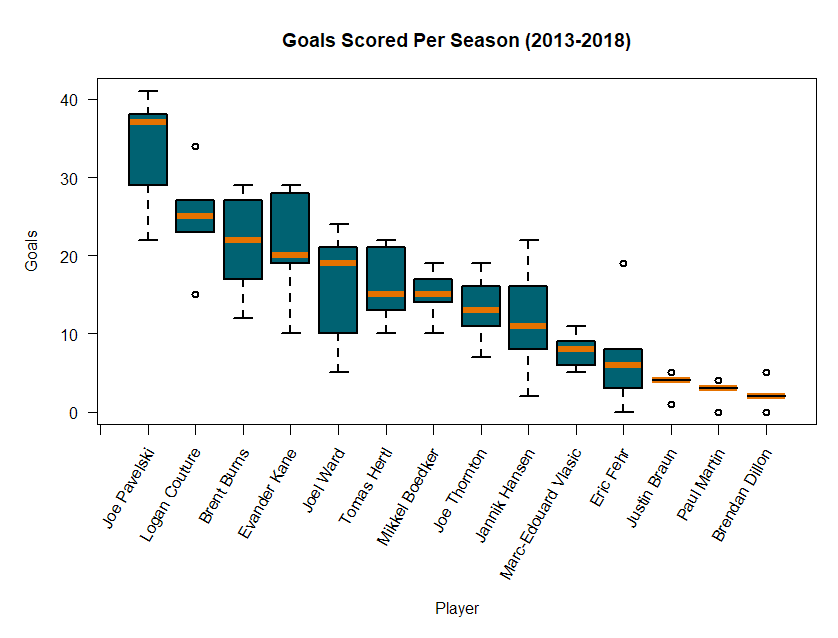
Thoughts:
- Based on John Tavares’s last five seasons, the median for his goals scored would be 33 and his best was 38 in 2014-2015. If included on this graph, he’d be the 2nd strongest goal scorer, right after Pavelski.
- Patrick Marleau was (sadly) traded to the Toronto Maple Leafs ahead of the 2017-2018 season. If he was never traded, he’d appear on this chart between Pavelski and Couture with a median goals scored of 27 and a season-high of 33 goals in 2013-2014.
- Of the recent Sharks additions excluded from this list, the only skaters with decent goal counts for a single season are Timo Meier (21 goals in 2017), Chris Tierney (17 goals in 2017), Joonas Donskoi (14 goals in 2017), and Kevin Labanc (11 goals in 2017). However, none of these are particularly impressive and these players will likely end up charted near the middle around Hertl or Boedker.
- As expected, defensemen occupy the bottom of the list. The clear exception here, of course, is Brent Burns. Seeing him occupy the 3rd highest slot despite being a defenseman is impressive.
- Admittedly, I didn’t realize Joe Pavelski’s production was that much higher than the rest of the team.
- Washington Capitals’s Alexander Ovechkin’s 5-year running goal median is 50. Wow. The Sharks need one of those.
Top 5 Fast Food Strawberry Milkshakes
I’ve been on the road a lot over the last few months. Admittedly, this means consuming more fast-food over the last several weeks than I have in the last several years. One can only consume the same fast-food salads over and over again before eventually feeling a need to explore the rest of the menus. Also, its been hot so…milkshakes.
Methodology: Not super scientific. I purchased the smallest size available at each place. Told myself I would stop at 5 but I couldn’t stop at a lower number, because then it would be a stupid looking list. Here’s how they ranked.
5. In-N-Out
Generous sizing. Not very strawberry-y. Too sweet. Internet research says the shake contained 67g of sugar. Oof.
4. McDonald’s
Whipped cream is a nice touch. Also not very fruity and also very very sweet. Liquid candy, but what did I expect. You have to slowly sip this one. Internet says 71g of sugar. Hoowwww….
3. Burger King
Seemed more drinkable and not obnoxiously sweet than the previous two…but then I looked it up and it has 91g of sugar. HOW? Is my tongue broken? I don’t remember the serving size being that much larger. In any case, I ranked them before I researched them so…#3 it is.
2. Sonic
T H I C C. Lower on the berry flavor than the previous three, but with the texture of real berries inside. This was the only one I had where I honestly thought it could have been sweeter, but it was also the last one I had and maybe my tongue got broken from the sugar overload of the previous shakes. Internet says 40g of sugar in my mini-shake. Thank you, Sonic, for offering a mini.
1. Del Taco
First one I had. Best tasting shake–the strongest strawberry flavor of the bunch and with the texture of real berries. Mini-sized for $1. A little on the sweet side, but still very gulp-able. Internet says 40g of sugar in this tiny guy.
Final thoughts:
- The sugar alone in these shakes added 1,196 calories from added sugar into my diet, which I suppose isn’t too awful.
- Unless you are sharing with a group of friends, I honestly see no reason why anyone should ever buy anything larger than the smallest sized shake (other than $$$ of course).
- #1 (Del Taco) and #2 (Sonic) were the only shakes I actually enjoyed drinking. If you like your shakes really thick, pick Sonic. If you like your shakes more drinkable yet still creamy, pick Del Taco.
- I should have paid attention to sizing. There was a lot of variance between each location’s smallest size.
- Honestly, this was probably a good experience for me. I’m fairly repulsed at the idea of a shake/ice cream/soda by now. I can go another several years without one.
2018 Stanley Cup Playoff Conclusion
Capitals beat the Golden Knights 4-1. With the ongoing joke being that the Caps are just the Sharks of the Eastern Conference, I suppose I could say that my original pick for the winner was right all along, I just had the wrong conference. I’m very happy to see Washington finally get their win and I suppose the “Caps West” label for the Sharks can’t be applied anymore.
Highlights of this series for me:
- Devante Smith-Pelly was a joy to watch. You could see him putting in max effort during every shift, and it paid off. In only 24 playoff games, Smith-Pelly matched his goal count of 7 goals that he scored during the regular season.
- Braden Holtby’s “The Save” + nervous Ovi during the final moments of game 2. It gave Washington their first win may have very well been the source of the momentum that carried them through their next 3 wins.
- The simple fact that we had a Las Vegas vs Washington D.C. match-up. I’m always in favor of anything that spreads awareness of of this sport that I enjoy watching and playing. Having a finals between a brand new hockey market (Vegas) and a team fighting for their very first championship (Washington) will likely bring in new fans.
Predictions/Hopes for next season
- Healthy Joe Thornton at 1C and contributing as he did before his injuries
- Sharks do not win any major trades or acquisitions (e.g. Tavares or Kovalchuk) but their 3rd and 4th forward lines and bottom defensive pairings blossom in the 2018-2019 season. Boedker has a breakout year.
- Injury-free Evander Kane
- Joe Pavelski evolves his playing style. As legendary as he is at fighting for space in front of the net and tipping shots, I worry this play style is diminishing in effectiveness. Pavelski’s goal counts have almost monotonically decreased since 2013-2014. With the projected 2018-2019 top line being Kane-Thornton-Pavelski, the Sharks run the risk of having a very slow top line. I’d like to see a bit more symmetry between Kane’s and Pavelski’s speed of movement so there’s always someone opening up for Thornton to feed.